Market intelligence
See the Port Alberni market more clearly.
A live view of active inventory, asking-price ranges, property types, and neighbourhood activity.
Current snapshot November 14, 2026 Updated from active listing data
New listings / month 69
↑ 1% more new listings vs. the same 3-month period last year
Average sales / month
27
↓ 17% fewer sales vs. the same 3-month period last year
Sales-to-active ratio11%8.8 months of supply
Buyer's marketBalancedSeller's market
The numbers behind it.
Over the last three months, the market averaged 69 new listings and 27 sales per month. Median days on market averaged 60 days — 18 days slower than the same period last year. Sale-to-list averaged 96.2%, 0.1 percentage points higher than the same period last year.
Price index · updated nightly
Port Alberni, indexed.
Market summary › Port Alberni
$524KCAD asking index
BCRE: PAL
Asking index from active listings, updated nightly · sold index from monthly sales · not an appraisal
Property-type indexes
Ticker2Y trendAsking1Y
Neighbourhood indexes
Related markets
News stories
From local and national news sources
‘It’s terrifying’: Flood waters wash out highway to Bamfield and threaten homesChristian-based group in Port Alberni eager to launch residential recovery houseB.C. realtor nearing 44 million views from Google photography daysHome Town Takeover Canada launch puts Port Alberni in spotlightHGTV corrects listingEby announces B.C. grocery ‘price guard’ during Kelowna visit
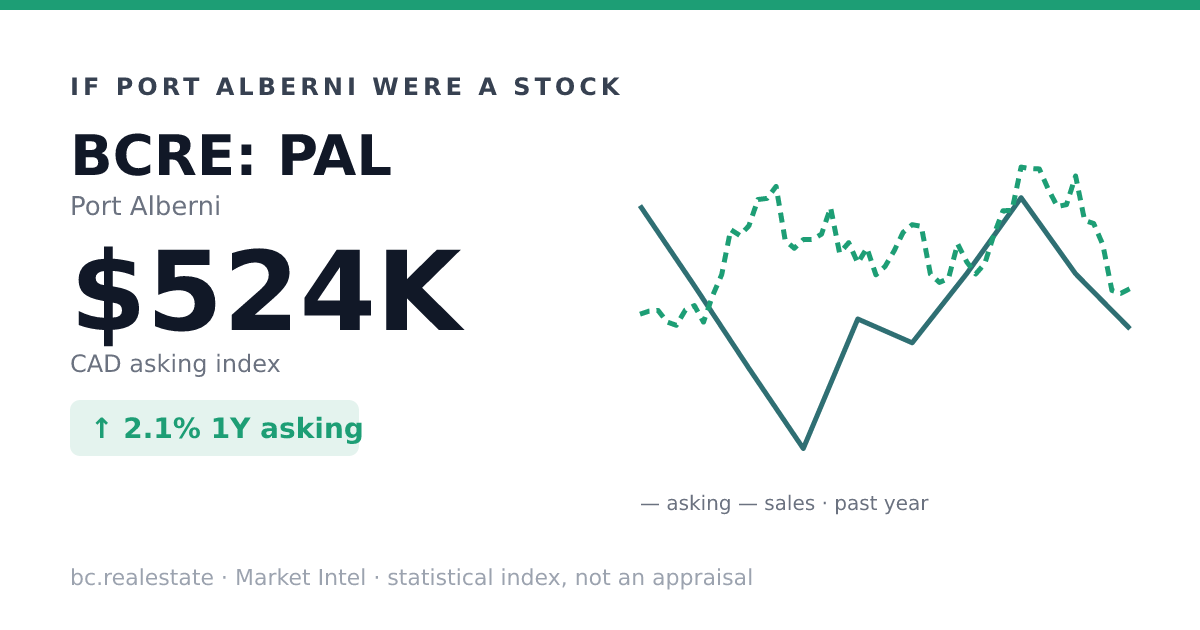
Share card
Share the Port Alberni market
A snapshot of today's ticker, refreshed nightly. Post it, text it, or drop it in a newsletter. The link opens this page with the live numbers.
Two years in view
New listings and sales over time
New listings Sales
Faint lines show monthly activity; the stronger lines are six-month averages. Residential and condominium records come from Repliers.
What happened to prices
Median single-family home sold price
24-month change -8.0%
Starting median $578K
Latest median $531K
Monthly median sold prices for single-family homes can move with the mix of properties sold. A change does not necessarily mean every individual property gained or lost the same amount.
Price distribution
Where current inventory sits
Property types
Active listings by property type
Manufactured Homes $287K 14 · 6% Condos $307K 16 · 7% Lots & Land $330K 43 · 18% Townhomes $435K 13 · 5% Detached Homes $629K 151 · 64%
Median asking price; the bar shows how many are for sale. 237 residential listings. Commercial and other types aren't included.
Across Vancouver Island
Which markets are heating up or slowing down?
The last three months are compared with the same three months a year earlier, using prices, days on market, sale-to-list ratios, and sales relative to new listings.
1 Heating Up 4 Steady 2 Mixed 6 Slowing Down
Momentum describes recent direction, not whether a market is expensive or inexpensive. Median prices can also move when the mix of homes sold changes.
Elsewhere in BC
How other BC markets are moving
The last three months are compared with the same three months a year earlier, using prices, days on market, sale-to-list ratios, and sales relative to new listings.
2 Heating Up 1 Steady 2 Mixed 4 Slowing Down
Momentum describes recent direction, not whether a market is expensive or inexpensive. Median prices can also move when the mix of homes sold changes.
About this data
A current-inventory view
These figures describe active listing inventory and asking prices. They are not sold-price statistics or a formal market appraisal. Contact a local REALTOR® for advice based on your property, timing, and neighbourhood.
What the numbers say
The market at a glance
Port Alberni currently has 251 active residential listings. The median asking price across current inventory is $540K. Detached Homes make up the largest property category, with 151 active listings. The largest share of available inventory is currently in the Under $350K price range. Sales represented 25% of new listings in Oct 26. New supply substantially outpaced completed sales, indicating more buyer choice and stronger competition between sellers. The median sold listing spent 59 days on market. Properties sold for 96.7% of asking price on average.